The Hidden Crisis of Utility Poverty
In the scorching heat of Texas summers and the unexpected freezes of winter, utilities like electricity, water and gas aren’t luxuries — they’re necessities. Yet for thousands of Texas families, keeping the lights on and homes heated consumes an outsized portion of their resources.
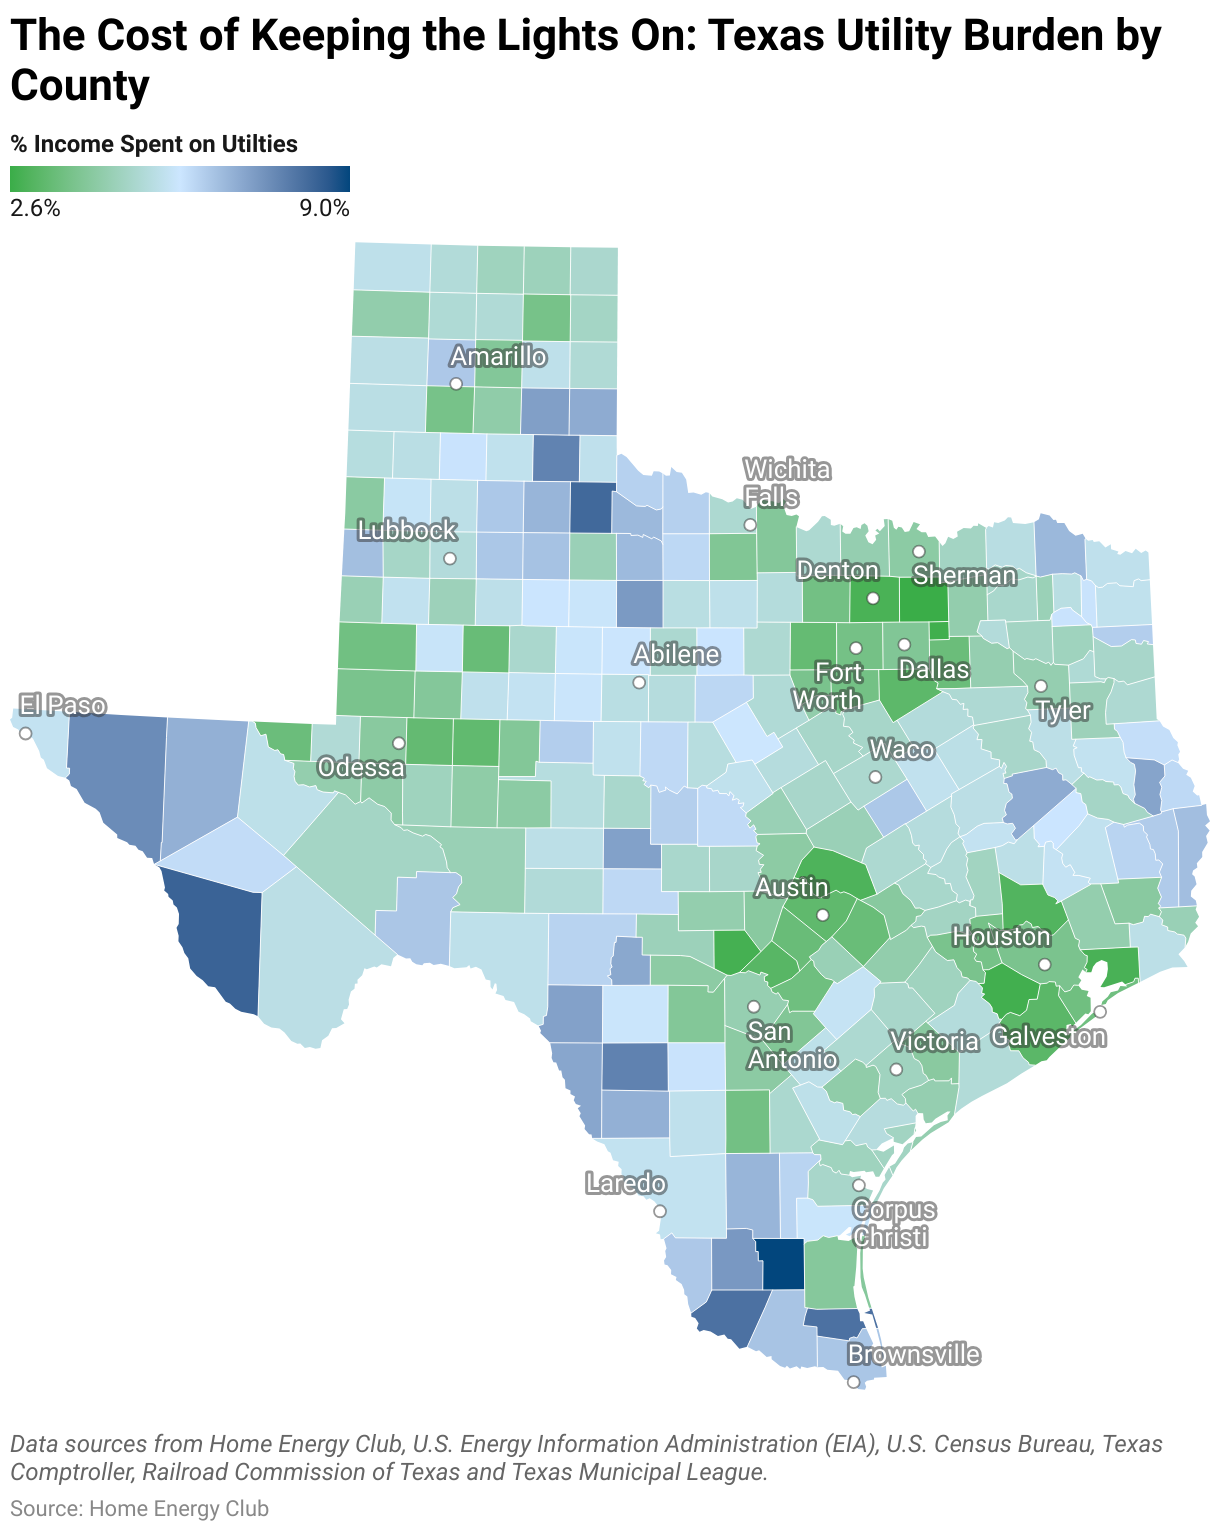
Our comprehensive analysis of utility costs across all 254 Texas counties reveals a troubling pattern. Families with higher incomes often spend a much lower percentage of their earnings on essential services. In contrast, lower-income families must dedicate a significantly higher portion of their budget to these same basic utilities, creating what experts call a “utility burden.”
The Most Burdened Communities
The data reveal that Brooks County residents face the highest utility burden in Texas, spending 9.0% of their household income on electricity, water and natural gas combined. With an average household income of just $32,743 according to U.S. Census Bureau data, these families struggle to afford the $2,936 they pay annually for essential services.
The counties with the highest utility burden share common characteristics: they’re predominantly rural, have median household incomes below $40,000, and are concentrated mainly in South and West Texas.
Counties with Highest Utility Burden (% of Income Spent on Utilities):
- Brooks County: 9.0% (avg. income: $32,743)
- Presidio County: 8.3% (avg. income: $35,521)
- Cottle County: 8.2% (avg. income: $35,417)
- Willacy County: 8.0% (avg. income: $36,139)
- Starr County: 8.0% (avg. income: $36,564)
Affluent Counties Enjoy Lower Utility Burden
By contrast, residents in Texas’s wealthiest counties spend a fraction of their income on utilities. The data shows that these counties have substantially higher median incomes, which helps mitigate the impact of utility costs even when the actual dollar amount spent is similar to that of lower-income counties.
Counties with Lowest Utility Burden (% of Income Spent on Utilities):
- Collin County: 2.6% (avg. income: $111,689)
- Rockwall County: 2.7% (avg. income: $107,824)
- Fort Bend County: 2.7% (avg. income: $102,816)
- Kendall County: 2.8% (avg. income: $105,675)
- Chambers County: 2.9% (avg. income: $96,799)
These counties, primarily clustered around major metropolitan areas like Dallas, Fort Worth and Houston, benefit from higher incomes that make utility costs a manageable expense rather than a financial burden. For example, Collin County residents pay approximately $2,933 annually for utilities — nearly the same amount as Brooks County residents ($2,936) — but with more than three times the income.

- The average household income in counties with the lowest utility burden ($98,276) is nearly 3x higher than in counties with the highest burden ($36,861).
- Despite this large income gap, both groups spend almost very similar amounts on utilities annually: $2936 vs. $2889.
- This results in a utility burden of 8% for the poorest counties compared to just 2.8% for the wealthiest.
Regional Patterns Reveal Geographic Inequality
Utility burden doesn’t fall evenly across Texas regions. Our analysis shows significant disparities:
- South Texas: 6.7% average utility burden (avg. income: $45,822)
- West Texas: 6.2% average utility burden (avg. income: $48,703)
- East Texas: 5.2% average utility burden (avg. income: $56,409)
- Central Texas: 3.6% average utility burden (avg. income: $85,086)
- North Texas: 3.4% average utility burden (avg. income: $86,485)
The state average utility burden is 5.1%, but this figure masks the extreme disparities between regions and individual counties.
The Utility Cost Breakdown
Electricity dominates household utility expenses across Texas, accounting for approximately 70% to 75% of total utility costs in most counties. According to U.S. Energy Information Administration (EIA) data, in high-burden counties, the average breakdown is:
- Electricity: 71% to 75% of utility costs
- Water: 21% to 22% of utility costs, based on Texas Municipal League water consumption data
- Natural gas: 3% to 8% of utility costs, according to the Texas Comptroller’s natural gas price data
Interestingly, the actual dollar amount spent on utilities doesn’t vary dramatically between the highest and lowest burdened counties. The average annual utility cost in the 10 highest-burden counties is approximately $2,936, while residents in the 10 lowest-burden counties pay about $2,889.
This reveals that the utility burden disparity stems primarily from income inequality rather than significant differences in consumption or service costs. While low-income households may try to conserve energy and water to reduce costs, they cannot escape the baseline expenses required for essential services.
The Compounding Impact of Utility Rate Increases
When electricity rates increase, households feel the impact in proportion to their current burden. Our analysis shows that a 10% electricity rate increase would affect all communities, but the impact varies:
- In Brooks County (highest burden), costs would increase from 9.0% to about 9.6% of income
- In Collin County (lowest burden), costs would increase from 2.6% to about 2.8% of income

While the percentage point increase is similar across counties (0.2-0.3 percentage points), the practical impact is much greater for low-income households, where every dollar is already stretched thin.
According to the Department of Energy (DOE), a utility burden above 6% — a threshold many South and West Texas counties already exceed — is considered “high”.
Our data on electricity rates for deregulated cities shows that even small rate increases can have significant impacts on household budgets in vulnerable communities. According to EIA data on average electricity usage, high-consumption months during extreme weather can further exacerbate these burdens.
Utility Efficiency: Part of the Solution
Improving utility efficiency across electricity, water and gas usage offers one path to reducing burden for vulnerable households. The American Council for an Energy-Efficient Economy (ACEEE) notes that low-income households, renters, African-American households and Latino households face higher utility burdens than the average household.
Efficiency programs specifically targeting high-burden communities could help reduce this disparity. However, these programs often reach only a small percentage of eligible households and need to address all utilities, not just electricity. For example, water conservation programs and improved insulation can help reduce both water bills and heating/cooling costs.
The Railroad Commission of Texas data on average natural gas monthly usage demonstrates that seasonal fluctuations in consumption can create additional financial strain for households already experiencing a high utility burden.
Policy Implications and Solutions
The data points to several policy approaches that could help address utility inequality in Texas:
- Targeted assistance programs that focus on counties with the highest utility burdens
- Weatherization and efficiency initiatives for electricity, water and gas usage in low-income households
- Rate structure reforms that consider income levels when setting utility rates across all services
- Renewable energy and water conservation access for low-income communities to reduce long-term costs
- Consumer protections during extreme weather events, when utility costs can spike
According to the Texas Energy Poverty Research Institute, utility costs are a leading cause of financial hardship for low-income Texans, and policy solutions should address both immediate affordability and long-term sustainability across all essential utility services.
Conclusion: A Call for Utility Equity
Electricity, water, and natural gas are not luxuries — they’re essential services every Texas family deserves access to at a reasonable cost. Our analysis reveals that the current system places a disproportionate utility burden on those least able to bear it.
As Texas continues to grow and utility demands increase, policymakers, utility providers and communities must work together to ensure that all Texans can afford to keep their lights on, water running and homes comfortable, regardless of income level or geography.
The path to utility equity will require intentional policies, targeted investments and a recognition that affordable essential services are not just an economic issue but a matter of basic fairness and human dignity.
Sources
Primary Data Sources Used in Analysis:
- Electricity costs (Home Energy Club): Deregulated city electricity rates
- Electricity costs (EIA): Regulated city electricity rates
- Average electricity usage monthly (EIA): Monthly and annual usage data
- Median income by county (U.S. Census Bureau): Household income statistics
- Average natural gas cost (Texas Comptroller): County average prices
- Average natural gas monthly usage (Railroad Commission of Texas): Residential consumption data
- Average water consumption (Texas Municipal League): Water and wastewater survey results
Additional References:
- Department of Energy – Low-Income Community Energy Solutions
- American Council for an Energy-Efficient Economy (ACEEE)
- Texas Energy Poverty Research Institute
- Texas Department of Housing and Community Affairs
- Public Utility Commission of Texas
Methodology: This analysis used data from the Home Energy Club, Energy Information Administration (EIA), U.S. Census Bureau, Texas Comptroller, Railroad Commission of Texas and Texas Municipal League to calculate utility costs and utility burden across all 254 Texas counties. Utility burden is defined as the percentage of household income spent on electricity, water and natural gas services annually.
For more information on utility assistance programs in Texas, visit the Texas Department of Housing and Community Affairs and the Public Utility Commission of Texas.